Executive-level diversity an accelerating trend in the federal public service

Over the past seven years, the public service has shown a notable rise in the representation of visible minorities, including at the executive level where there is a particularly rapid increase over the last three years.
The government continues to expand public service employment equity data in its annual reports with the 2022-23 report providing detailed breakdowns by equity group and executive (EX) levels. The report also presents disaggregated data for sub-groups in terms of numbers, hirings, promotions, and separation.
The trend of expanding diversity reflects the government’s ongoing priority in this area, and the impact of the then-clerk’s Call to Action on Anti-Racism, Equity, and Inclusion, launched on June 23, 2021, by former Clerk of the Privy Council Ian Shugart to make the public service more inclusive. John Hannaford, who took on the top public service role in June 2023, has continued that work, and said he is “resolutely committed to continuing the important work laid out” in the 2021 directive.
The trend also reflects demographic realities in Canada and the increasing numbers of visible minorities. This increase has occurred in the context of an expanding public service, from 185,000 in 2016-17 to 253,000 in 2022-23—an overall increase of 40 per cent. Notably, the number of executives has grown by 44 per cent during this period. Although the share of executives has remained steady at three per cent over the past decade, it marks a significant rise from the 1.7 per cent recorded in the mid-1990s.
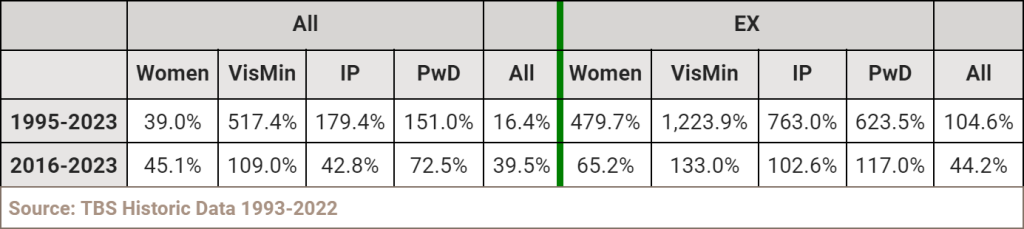
Change from 1995-2023 and 2016-2023
Figure 1 highlights the extent of the increase by equity groups for all employees and executives by all years as well as the current government. Visible minority representation has grown the most, but other equity groups have also increased significantly, particularly executives.
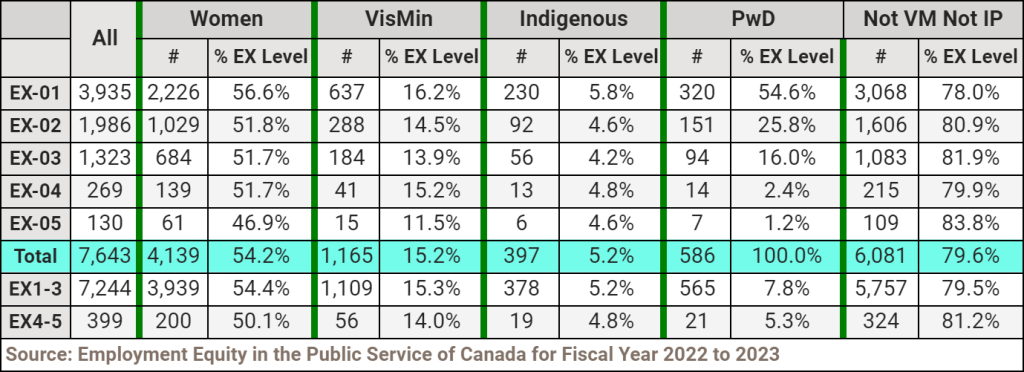
Executive levels by equity group
Figure 2 offers a detailed breakdown by executive level for the various equity groups. While the typical trend of representation declining at higher seniority levels persists, there’s a noteworthy exception at the EX-04 assistant deputy minister (ADM) level. The increased representation compared to more junior levels for both visible minorities and Indigenous Peoples suggests a deliberate effort to enhance their representation among ADMs. Conversely, persons with disabilities (PwD) are overwhelmingly at the junior EX levels.
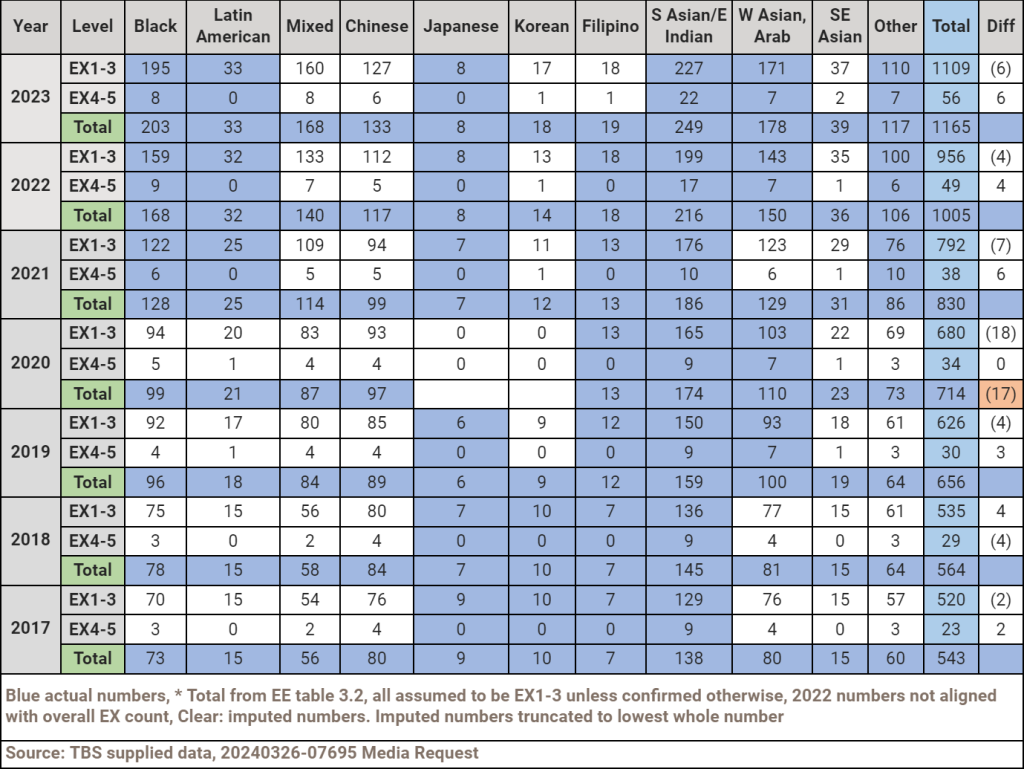
Executives by visible minority subgroups
The Treasury Board Secretariat provided disaggregated data for visible minorities and Indigenous executives for the EX-1/3 and EX-4/5 levels. However, due to confidentiality provisions and the fact that ADMs constitute only about five per cent of the total EX population, only total numbers could be disclosed without separation by gender. Additionally, confidentiality requirements limit the breakdown to only five groups—Black, Latin American, Japanese, South Asian, and “other”—for the last three years, with only South Asian available for the entire seven years.
The 2022-23 report underscores a notable increase in representation among ADMs from 2020 to 2023: visible minorities rose from six to 29 per cent, Indigenous Peoples from two to nine per cent, and persons with disabilities from zero to two per cent. This likely reflects the response by deputies to the call to action.
To provide a comparative illustration of relative representation, Figure 3 presents both the official numbers and imputed numbers using the 95 per cent EX-01/3 and five per cent EX-04/5, truncated to the lowest whole number. Official numbers are denoted in blue with the last column indicating any under or over-imputed figures by level. This method over-estimates the number of EX-4/5 compared to EX-1/3, thus accentuating the disparity between groups with a higher proportion of ADMs—Black, South Asian, West Asian/Arab, and “Other”—and those with fewer.
Among the larger groups, the under-representation of Chinese-Canadian public servants is notable. Black representation saw the most significant increase, rising by 167 per cent compared to 2017, followed by West Asian/Arab at 114 per cent, and South Asian at 65 per cent.
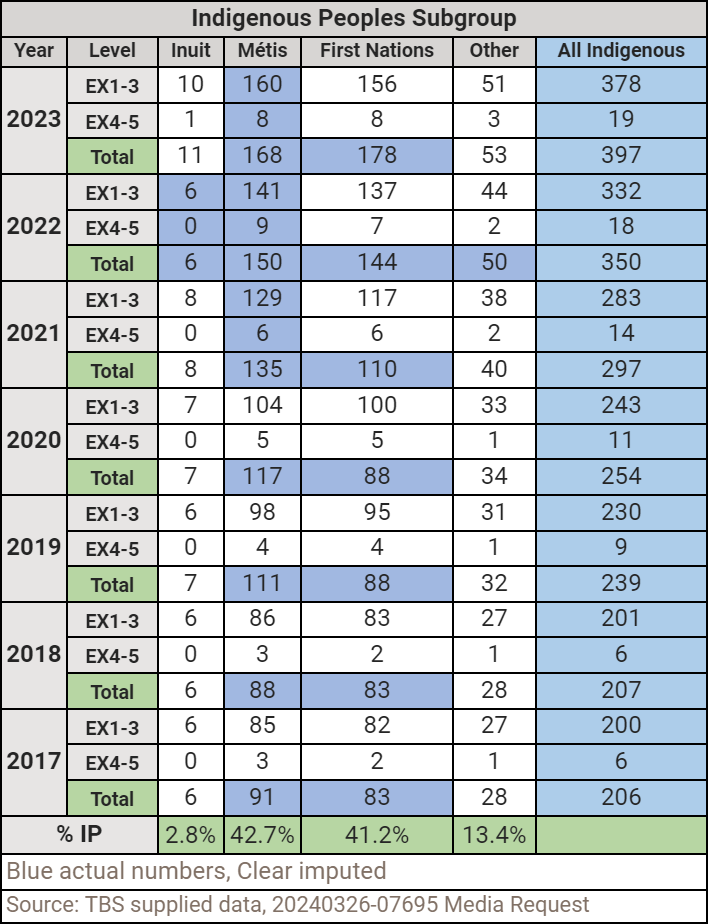
Applying a similar methodology to Indigenous executives is more problematic as there are only official breakdowns between executive levels for Métis. Despite the total number of First Nations executives being comparable to that of Métis, there are too few EX-4/5 to report separately. Additionally, there are no total numbers available for Inuit except for the year 2022.
Nevertheless, the total Indigenous executive figures suggest a modest increase in the proportion of EX-04/5, rising from 2.9 per cent in 2017 to 4.8 per cent in 2023, largely aligning with the general proportion.
Executives by Indigenous Peoples subgroups
Figure 4 employs a different methodology for illustrative purposes. It takes the relative shares of Inuit, Métis, First Nations, and other and applies them to the total number of EX-1/3 and EX-4/5. Once again, official figures are represented in blue, while all other figures are imputed. The most notable aspect here remains the contrast between Métis and First Nations given their comparable total numbers of executives.
Representation, hiring, promotion, and separation rates comparison
Contributing to this increase in representation is the trend in the overall hiring, promotion, and separation rates for visible minorities, and less so for Indigenous Peoples.
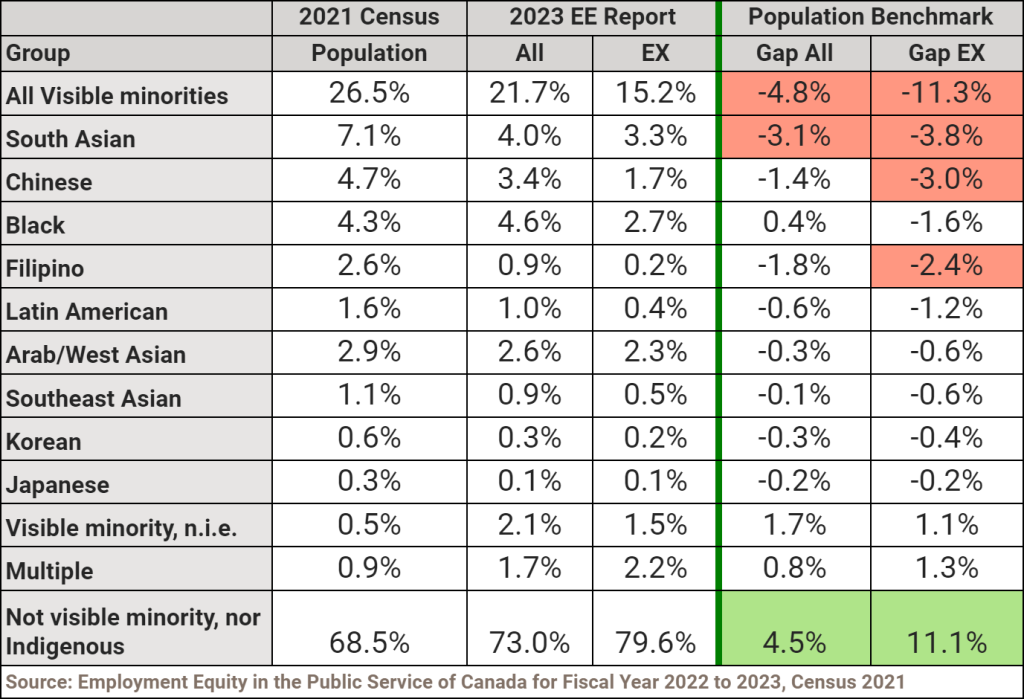
While the longstanding trend of an increased share of visible minorities persists, disparities persist for most groups at both the all public servants and executive levels, as illustrated in Figure 5.
Visible minority representation 2023 compared to population
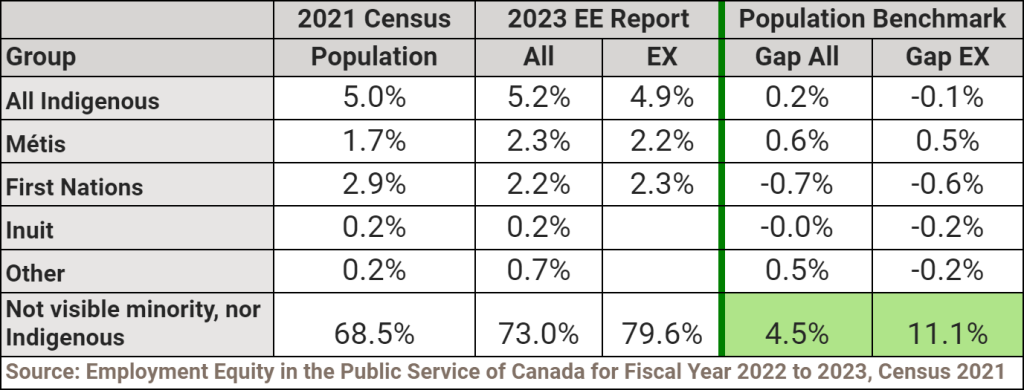
Indigenous Peoples representation 2023 compared to population
Regarding Indigenous Peoples, the disparities for both all public servants and executives are relatively minor with Métis slightly overrepresented compared to their share of the population, as indicated in Figure 6.
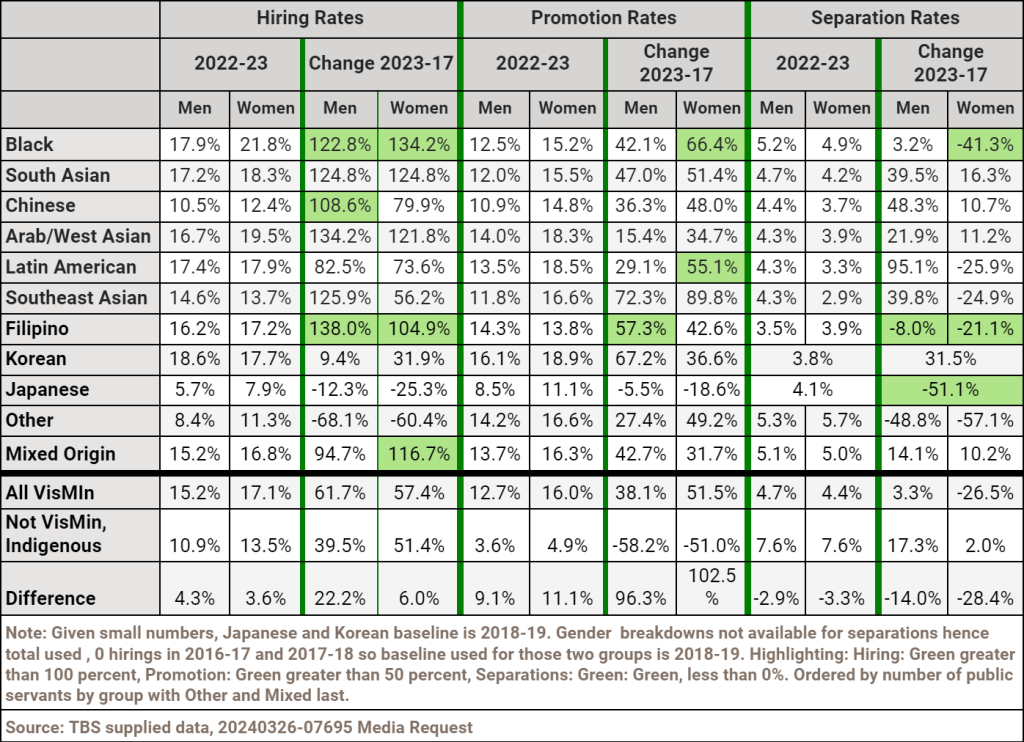
Visible minority comparison by group and gender
Figure 7 presents a comparison of these rates for 2022-23, and the growth since 2016-17. The surge in hiring rates for most groups surpasses 100 per cent with promotion rates increasing by over 50 per cent in many groups, particularly for women. Furthermore, fewer women across most groups are exiting government service. Notably, both hiring and promotion rates of visible minorities exceed those of individuals who are neither visible minority nor Indigenous, while separation rates are lower. This is partly attributed to a larger proportion of younger public servants with over 30 per cent being 34 years old or younger.
Indigenous Peoples comparison by group and gender
Figure 8 contrasts these rates for 2022-23 with the growth observed since 2016-17. Hiring rates for Inuit have experienced a decline, while Métis men and women exhibit the most substantial increase in hiring. Promotion rates are higher for women across all three Indigenous groups compared to men, with Métis showing only a marginal difference. Separation rates for Inuit men and women have decreased, while they have increased for the other two groups. Additionally, separation rates for men are lower than those for individuals who are neither visible minority nor Indigenous, although they have increased significantly, reflecting the higher average age.
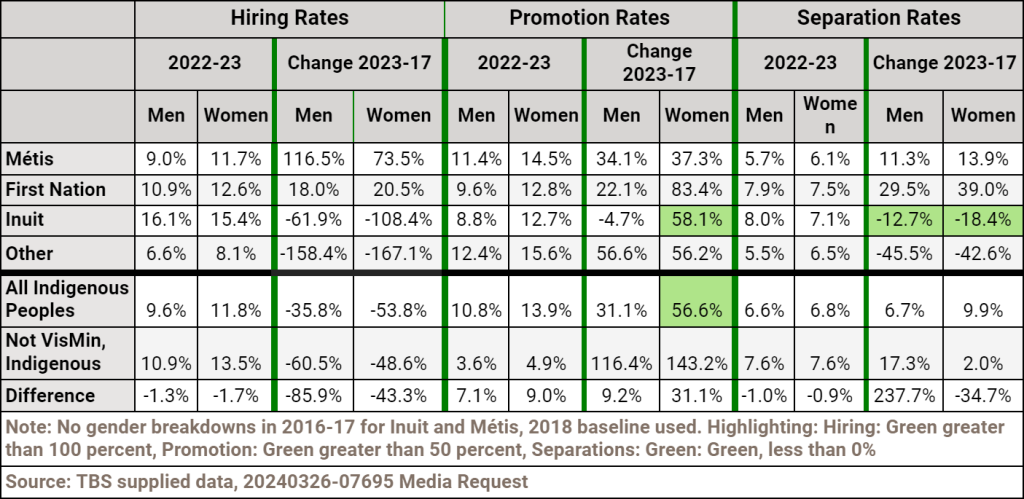
The public service continues a longer-term trend where women—regardless of being a visible minority, Indigenous, or not—are hired and promoted at higher rates than men for most groups.
Concluding observations
It is clear that the public service is making a concerted effort to improve representation at senior executive levels as well as across the public service while sharing more granular data to showcase progress. The significant strides made in recent years can be attributed in part to the Privy Council clerk’s 2021 call to action and its annual reporting, particularly evident at the ADM level, alongside underlying demographic shifts.
Among visible minority groups, the representation of Black people has shown the most notable improvement for all public servants and executives likely reflecting the influence of Black Lives Matter and possibly the Black class action lawsuit.
While human resource policies are largely the purview of the public service, the current government’s focus on inclusion and its various policies and programs have bolstered efforts. This includes increased grant and contribution funding, both general and targeted to specific communities, expanded datasets, analysis, diversity and inclusion messaging, and consultations regarding the Employment Equity Act.
However, a future Conservative government is unlikely to be as supportive given scepticism regarding diversity, equity, and inclusion policies in general, and pressures to curb government and expenditures.
Nevertheless, the trajectory of the public service will likely continue toward greater diversity and representation as evidenced by the relative decline in hirings, promotions, and separations of individuals who are neither visible minority nor Indigenous.
Methodological notes:
While the overall number of ADMs was 399 in 2022-23, the normal confidentiality rule of not reporting five or fewer employees made gender breakdowns not possible. In addition, the Treasury Board Secretariat (TBS) engages in other data suppression where the cross referencing tables could be used to identify individuals. For example, in 2019-20 the total number of visible minority executives in the standard occupational table is higher than the breakdown of the number at the EX-1/3 and EX-4/5 levels in the data provided by TBS (the only year that occurs). For Indigenous people, this discrepancy occurs in most years. The methodology used to input numbers is detailed above with the relevant figures.
Andrew Griffith is the author of ‘Because it’s 2015…’ Implementing Diversity and Inclusion, Multiculturalism in Canada: Evidence and Anecdote and Policy Arrogance or Innocent Bias: Resetting Citizenship and Multiculturalism and is a regular media commentator and blogger (Multiculturalism Meanderings). He is the former director general for Citizenship and Multiculturalism, has worked for a variety of government departments in Canada and abroad, and is a fellow of the Environics Institute.
The Hill Times


 LICENSING
 PODCAST
 ALERTS